Home
Products
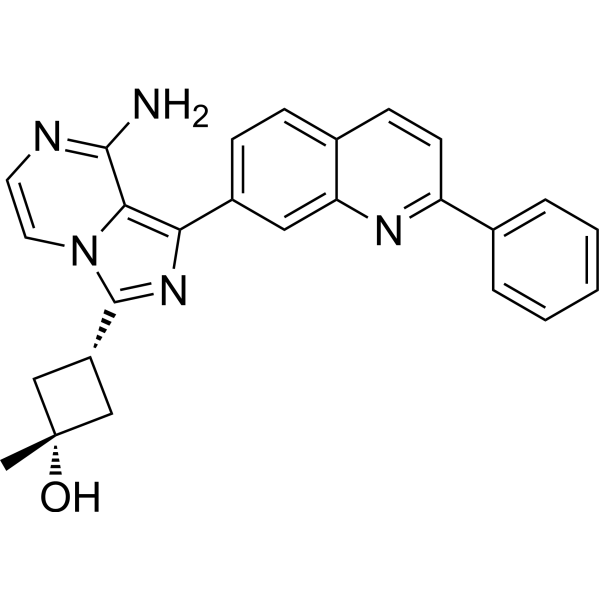
Linsitinib (OSI-906)


| Product Name | Linsitinib (OSI-906) |
| Price: | Inquiry |
| Catalog No.: | CN00344 |
| CAS No.: | 867160-71-2 |
| Molecular Formula: | C26H23N5O |
| Molecular Weight: | 421.49 g/mol |
| Purity: | >=98% |
| Type of Compound: | Alkaloids |
| Physical Desc.: | Powder |
| Source: | |
| Solvent: | Chloroform, Dichloromethane, Ethyl Acetate, DMSO, Acetone, etc. |
| SMILES: | Nc1nccn2c1c(nc2[C@@H]1C[C@](C1)(C)O)c1ccc2c(c1)nc(cc2)c1ccccc1 |
| Contact us | |
|---|---|
| First Name: | |
| Last Name: | |
| E-mail: | |
| Question: | |
| Description | Losmapimod is a dual inhibitor of the IGF-1 receptor and insulin receptor with IC50s of 35 and 75 nM, respectively. |
| Target | IC50: 35 nM (IGF-1R), 75 nM (InsR) |
| In Vitro | Linsitinib inhibits IGF-1R autophosphorylation and activation of the downstream signaling proteins Akt, ERK1/2 and S6 kinase with IC50 of 0.028 to 0.13 μM. Linsitinib enables an intermediate conformation of the target protein through interactions with the C-helix. Linsitinib displays favorable metabolic stability in liver microsomes. Linsitinib fully inhibits both IR and IGF-1R phosphorylation at a concentration of 1 μM. Linsitinib inhibits proliferation of several tumor cell lines including non-small-cell lung cancer and colorectal cancer (CRC) tumor cell line with EC50 of 0.021 to 0.810 μM[1]. |
| In Vivo | Linsitinib inhibits tumor growth in an IGF-1R-driven xenograft mouse model, with 100% TGI and 55% regression at a dose of 75 mg/kg and 60% TGI and no regression at a dose of 25 mg/kg. Linsitinib administration induces different elimination half-lives of itself in dog, rat and mice, the elimination half-lives are 1.18 hours, 2.64 hours and 2.14 hours, respectively. Linsitinib administration at different single dose once-daily in femal Sprague-Dawley rat and femal CD-1 mouse reveal that the Vmax is not dose-proportional to Linsitinib dose. Linsitinib elevates the blood glucose levels at a dose of 25 mg/kg after 12 days administration. Linsitinib administration at a single dose of 75 mg/kg in IGF-1R-driven full-length human IGF-1R (LISN) xenograft mouse model achieve maximal inhibition of IGF-1R phosphorylation (80%) between 4 and 24 hours with plasma drug concentrations of 26.6-4.77 μM[1]. Linsitinib administered as a single dose of at 60 mg/kg in NCI-H292 xenografts mice inhibits uptake of glucose at 2, 4, and 24 hours post-treatment in vivo. Linsitinib inhibits the growth of tumors in NCI-H292 xenograft mouse model[2]. |
| Cell Assay | For assays of cell proliferation, cells are seeded into 96-well plates in appropriate media containing FCS 10% and incubated for 3 days in the presence of Linsitinib at various concentrations. Inhibition of cell growth is determined by luminescent quantitation of intracellular ATP content using CellTiterGlo. Data is presented as a fraction of maximal proliferation, calculated by dividing the cellular density in the presence of varying concentrations of Linsitinib by the cellular density of control cells treated with vehicle (DMSO) only. |
| Animal Admin | Cells are harvested from cell culture flasks during exponential cell growth, washed twice with sterile PBS to a suitable concentration before subcutaneous implantation on the right flank of female nu/nu CD-1 mice. Tumors are established to 200±50 mm3 in size before randomization into treatment groups of eight mice each for efficacy studies. Linsitinib or vehicle is administered orally as indicated. The %TGI values indicated are the median %TGI over the entire dosing period. TGI of at lease 505 is considered significant. Growth delay is calculated as T-C shere T and C are the times in days for mean tumor size in the treated (T) and control (C) groups to reach 400% of the initial tumor volume. Cures are excluded from this calculation. |
| Density | 1.4±0.1 g/cm3 |
| Exact Mass | 421.190247 |
| PSA | 89.33000 |
| LogP | 3.23 |
| Storage condition | -20℃ |