Home
Products
SRT1720 HCl


| Product Name | SRT1720 HCl |
| Price: | Inquiry |
| Catalog No.: | CN00564 |
| CAS No.: | 1001645-58-4 |
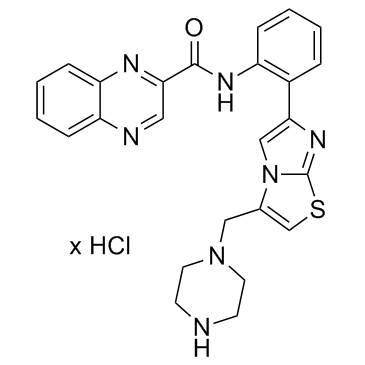
| Molecular Formula: | C25H23N7OS.HCl |
| Molecular Weight: | 506.02 g/mol |
| Purity: | >=98% |
| Type of Compound: | Alkaloids |
| Physical Desc.: | Powder |
| Source: | |
| Solvent: | Chloroform, Dichloromethane, Ethyl Acetate, DMSO, Acetone, etc. |
| SMILES: | O=C(c1cnc2c(n1)cccc2)Nc1ccccc1c1cn2c(n1)scc2CN1CCNCC1.Cl |
| Contact us | |
|---|---|
| First Name: | |
| Last Name: | |
| E-mail: | |
| Question: | |
| Description | SRT 1720 Hydrochloride is a selective activator of SIRT1 with an EC1.5 of 0.16 μM, and shows less potent activities on SIRT2 and SIRT3 with EC1.5s of 37 μM and 300 μM, respectively. |
| Target | SIRT1:0.16 μM (EC1.5) SIRT2:37 μM (EC1.5) |
| In Vitro | SRT1720 effectively decreases the acetylation of p53 in cells even in the absence of SIRT1, and this is attributed to inhibition of histone acetyltransferase p300[2]. |
| In Vivo | SRT1720 (10, 30, 100 mg/kg, p.o.) significantly reduces the hyperinsulinaemia after 4 weeks, partially normalizing elevated insulin levels similar to rosiglitazone treatment. SRT1720 treatment significantly reduces fasting blood glucose to near normal levels in Lepob/ob mice[1]. SRT1720 has ability to protect against the negative effects of diet-induced obesity in mice, and has a connection to metabolic adaptation in fatty acid and oxidative metabolism through downstream targets of SIRT1 such as PGC1α and FOXO1[2]. SRT1720 (50-100 mg/kg, p.o.), during emphysema development attenuates elastase-induced airspace enlargement and lung function impairment as well as reduces arterial oxygen saturation in WT mice[3]. |
| Animal Admin | Mice: Nine week old C57BL/6 male mice are fed a high fat diet (60% calories from fat) until their mean body weight reach approximately 40 g. The mice are then divided into test groups (6-10 per group). SRT1460 (100 mg/kg), SRT1720 (100 mg/kg), SRT501 (500 mg/kg) and rosiglitazone (5 mg/kg) are administered once daily via oral gavage. The vehicle used is 2% HPMC + 0.2% DOSS. Individual mouse body weights are measured twice weekly. At 2, 4, 6, 8 and 10 weeks of dosing a fed blood glucose measure is taken and after 5 weeks of treatment an IPGTT is conducted on all mice from each of the groups. After 10 weeks of treatment, an ITT is conducted. Statistical analysis is completed using the JMP program. Data are analyzed by a one way ANOVA with comparison to control using a Dunnett’s Test. A p value < 0.05 indicates a significant difference between groups. |
| Density | 1.58 |
| Exact Mass | 505.145142 |
| PSA | 115.69000 |
| LogP | 4.80520 |